Features/Hear from users

Product analytics

Analytics you talk to.

Rectify captures page views, clicks, friction, errors and Web Vitals on its own. Ask a question in plain English and Quanta answers with a chart. No dashboards to build.

0
extra lines of code
5
Core Web Vitals
Daily
brief, written for you

You installed analytics, built a dashboard, and haven’t opened it since.

Here, you just ask.

01

Captured automatically.

The widget script records page views, clicks and scroll depth, friction like rage clicks and dead clicks, JavaScript errors and failed requests, form submits (never the values), downloads, outbound links, site search and Core Web Vitals. Add custom events and revenue whenever you like.

Auto

captured with the script you already have

Page viewsClicksScroll depthRage clicksDead clicksJS errorsFailed requestsForm submitsLCPINPCLSUTM
02

Ask, and get a chart.

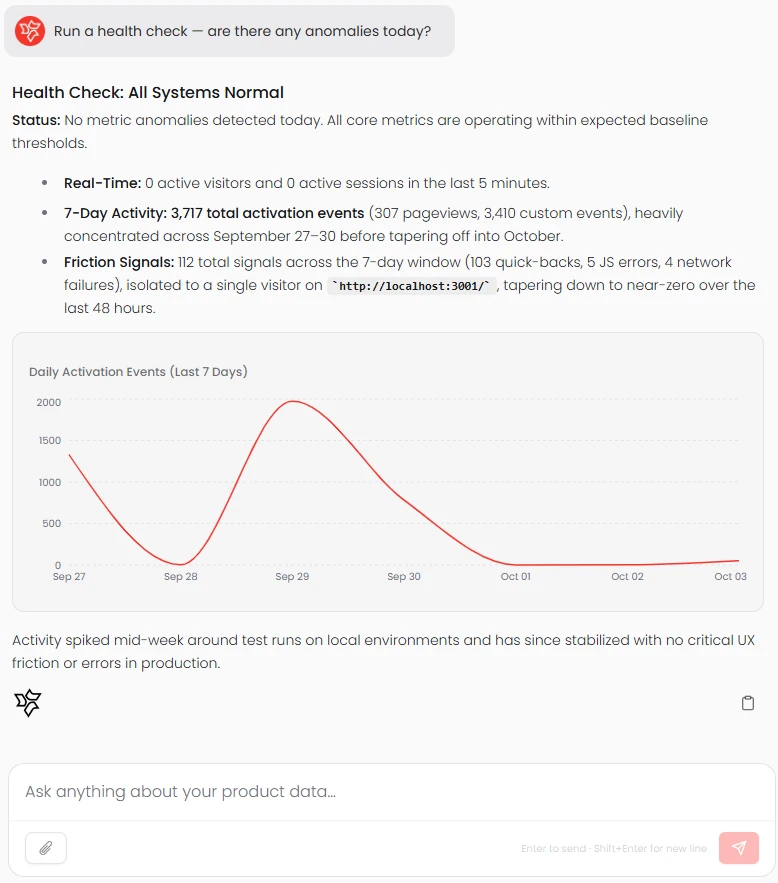
Funnels, retention, cohorts, activation, top pages, referrers, geography, devices, revenue and friction. Quanta answers with a chart and links what changed to your incidents, releases, feedback and surveys. Then it can turn the answer into a goal or an alert.

A health check: no anomalies today, with a chart of daily activation events
03

Start the day with a brief.

Open Analytics and get today’s brief: three to five headlines, one chart and three questions worth asking next. Or pick a quick start, from health check and funnels to retention and friction.

Today’s briefAnalytics
↑
Signups up 18%

Most came from the changelog post

↓
Checkout drop-off up 6%

9 rage clicks on the plan picker

→
INP steady at 190 ms

After the faster checkout release

Where do new signups come from?Show the checkout funnelCompare to last week
04

Goals and alerts.

Goals on any event or URL path, with no code needed. Alerts when page views, visitors, revenue or a custom event drop below, rise above or change by a percentage, delivered in the app or by email. Ask Quanta to set either up from an answer.

Goals and alertsAnalytics

Goals

Signed up · URL path /welcome0↑
Started a trial · Event trial_started0↑
Upgraded · Event plan_upgraded0→

Alerts

Unique signups drop 30% or more in 24 hours

Email Umar · in the app

Alert: signups down 34%

Since the checkout release. Quanta has a theory.

05

Heatmaps and a live feed.

Heatmaps (beta) show your top elements, how far people scroll and where they click, with rage and dead clicks per page. The activity feed (beta) streams what visitors are doing right now, grouped by session and linked to each person’s profile.

ActivityLive
SM
Sofia Marchetti

Milan · Chrome · Customer

Viewed /pricing
Clicked “Compare plans”
Rage click on the plan picker
Viewed /help/export-to-csv
Submitted feedback
Heatmap/pricing

68% scroll past the plans · 9 rage clicks

Ask Quanta

Don’t click through it. Just ask.

Ask in plain English and Quanta does the work. Anything that changes your data waits for a person to approve it.

QuantaOn shift

Where do people drop off in signup?

62% reach the form, 41% submit it and 33% verify their email. The biggest drop is the form: 9 rage clicks on the plan picker this week.

Ask Quanta to do anything

Everything in it

The details, all of them.

NavigationPage views and time on page
InteractionClicks, scroll depth, element views
FrictionRage clicks, dead clicks, quick backs
ErrorsJavaScript errors and failed requests
ConversionsForms, downloads, outbound links, search
Web VitalsLCP, FCP, CLS, TTFB, INP
ContextDevice, referrer, UTM, location
Your eventsIdentify, custom events, revenue, server API
ExportRaw events as CSV or JSON
PrivacyMask text, respect Do Not Track

Give your SaaS its first hire.

Free for 14 days. Set up in about two minutes.